Valgrind: memory and CPU profiling
Tracking memory leaks
Filters for usual errors
Final command line
Detection of bottlenecks
Command line
Example
Valgrind: memory and CPU profiling
Valgrind is a programming tool for debugging, memory leak detection and profiling.
It may be used together with GDB.
Tracking memory leaks
Valgrind provides a tool called Memcheck to analyse all memory allocation by instrumentation.
This tool is enabled with the following argument:
valgrind --tool=memcheck
In order to get a full heap usage summary, a few extra options are required:
valgrind --tool=memcheck --leak-check=full --show-leak-kinds=all
Filters for usual errors
There are plenty of states which do not depend on the controlled code of the processed program and which are detected by valgrind as bad bahaviour. Internal states of external libraries which can not be reverted are one example of such cases.
By default, valgrind uses the $PREFIX/lib/valgrind/default.supp file as source for suppressions of unwanted behaviours.
But other system packages can provide extra definitions. For instance on Debian:
$ dpkg -S .supp
valgrind: /usr/lib/valgrind/debian.supp
aisleriot: /usr/lib/x86_64-linux-gnu/valgrind/aisleriot.supp
python3: /usr/lib/valgrind/python3.supp
libncurses-dev:amd64: /usr/lib/valgrind/ncurses.supp
synaptic: /usr/share/doc/synaptic/README.supported
valgrind: /usr/libexec/valgrind/default.supp
libgtk-3-dev:amd64: /usr/share/gtk-3.0/valgrind/gtk.supp
libglib2.0-dev:amd64: /usr/share/glib-2.0/valgrind/glib.supp
It may be an advised choice to include all these definitions when running valgrind:
valgrind --tool=memcheck --leak-check=full --show-leak-kinds=all \
    --suppressions=/usr/libexec/valgrind/default.supp \
    --suppressions=/usr/lib/valgrind/debian.supp \
    --suppressions=/usr/share/gtk-3.0/valgrind/gtk.supp \
    --suppressions=/usr/share/glib-2.0/valgrind/glib.supp \
    --suppressions=/usr/lib/valgrind/python3.supp \
    ...
Moreover, Chrysalide defines extra definitions inside the tools/maint/extra.supp file.
Final command line
As the call stack has a 12-frame depth by default, it may be a good idea to increase it with an extra argument:
--num-callers=500
From the top level directory, the command to process ROST for instance is:
export LD_LIBRARY_PATH="$PWD/src/.libs:$LD_LIBRARY_PATH"

valgrind --tool=memcheck --leak-check=full --show-leak-kinds=all \
    --suppressions=/usr/libexec/valgrind/default.supp \
    --suppressions=/usr/lib/valgrind/debian.supp \
    --suppressions=/usr/share/gtk-3.0/valgrind/gtk.supp \
    --suppressions=/usr/share/glib-2.0/valgrind/glib.supp \
    --suppressions=/usr/lib/valgrind/python3.supp \
    --suppressions=tools/maint/extra.supp \
    --num-callers=500 \
    --gen-suppressions=all \
    ./src/.libs/rost /tmp/rule.rost /bin/ls |& tee log
Detection of bottlenecks
Valgrind provides another tool called Callgrind: it collects data from all the executed instructions.
These records are useful to identify which call stacks consume the most processing time.
Command line
The tool can be run for isntance from the root directory of fresh compiled sources with the following command:
export LD_LIBRARY_PATH="$PWD/src/.libs:$LD_LIBRARY_PATH"

valgrind --tool=callgrind --callgrind-out-file=callgrind.log \
    --dump-instr=yes \
    --collect-jumps=yes \
    --collect-systime=yes \
    --collect-bus=yes \
    --cache-sim=yes \
    --branch-sim=yes \
    ./src/.libs/rost /tmp/rule.rost /bin/ls
Results can then get explored with a Qt application; kcachegrind.
Example
Here is a simple view for an excution of ROST:
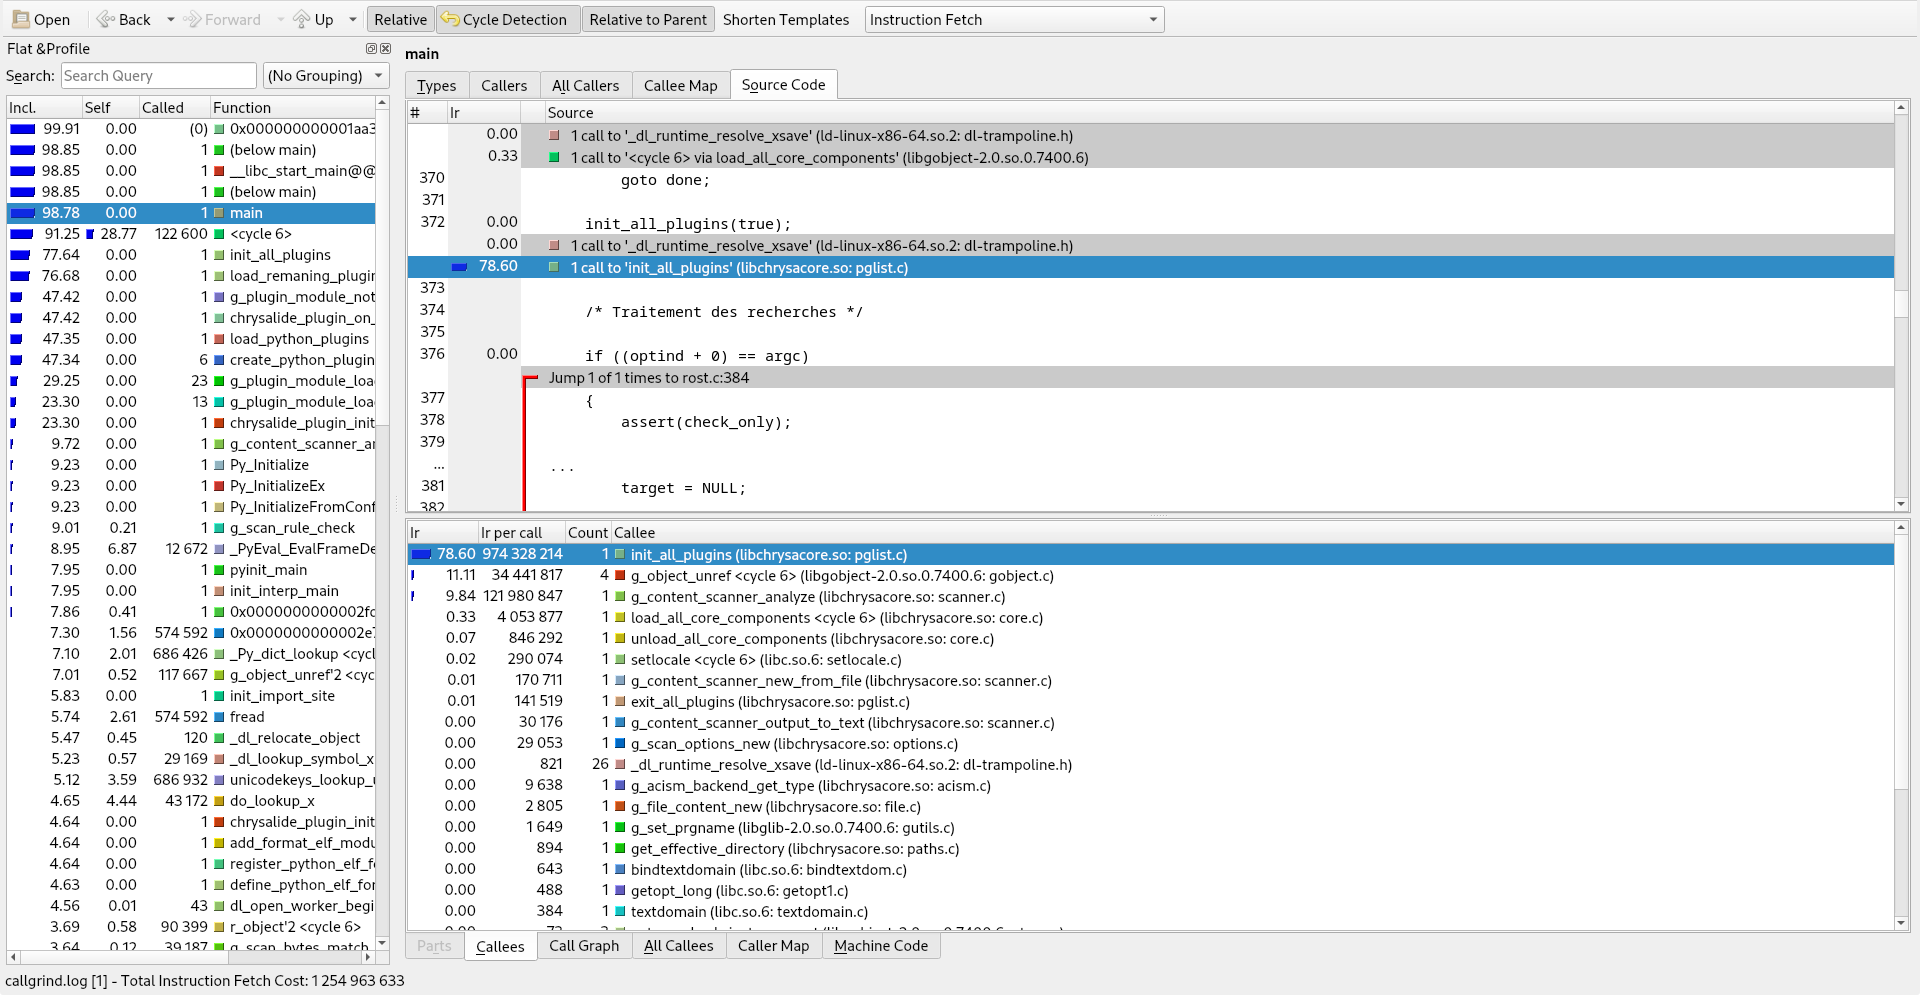
Collected data show that:
- 78.60% of execution is spent in loading the [Python] plugins;
- scanning the binary content takes less than 10% of the whole process;
- cleaning (cf.
g_object_unref()calls) consumes more than scanning.